← previous - home - next →
Table of contents
- 1-2 Introduction and Line plots
- 3-4 Figures and Subplots
- 5-6 Styles and Aesthetics
- 7-8 Saving and Color maps
- 9 Histograms
- 10-11 Boxplots Violinplots and Scatter plots
- 12 Animations
- 13 On the usage of Seaborn ← (Notebook)
On the usage of seaborn
Seaborn is a library to use matplotlib in an “easier” way. You can find information about it there.
Eventhough it does not have to be that way, it mainly uses pandas dataframes as input (more info there).
import pandas as pd
import seaborn as sns
dataset = sns.load_dataset('penguins')
dataset
| species | island | bill_length_mm | bill_depth_mm | flipper_length_mm | body_mass_g | sex | |
|---|---|---|---|---|---|---|---|
| 0 | Adelie | Torgersen | 39.1 | 18.7 | 181.0 | 3750.0 | Male |
| 1 | Adelie | Torgersen | 39.5 | 17.4 | 186.0 | 3800.0 | Female |
| 2 | Adelie | Torgersen | 40.3 | 18.0 | 195.0 | 3250.0 | Female |
| 3 | Adelie | Torgersen | NaN | NaN | NaN | NaN | NaN |
| 4 | Adelie | Torgersen | 36.7 | 19.3 | 193.0 | 3450.0 | Female |
| ... | ... | ... | ... | ... | ... | ... | ... |
| 339 | Gentoo | Biscoe | NaN | NaN | NaN | NaN | NaN |
| 340 | Gentoo | Biscoe | 46.8 | 14.3 | 215.0 | 4850.0 | Female |
| 341 | Gentoo | Biscoe | 50.4 | 15.7 | 222.0 | 5750.0 | Male |
| 342 | Gentoo | Biscoe | 45.2 | 14.8 | 212.0 | 5200.0 | Female |
| 343 | Gentoo | Biscoe | 49.9 | 16.1 | 213.0 | 5400.0 | Male |
344 rows × 7 columns
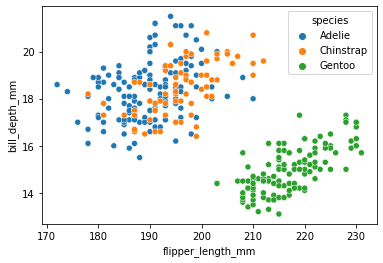
sns.scatterplot(data=dataset, x='flipper_length_mm', y='bill_depth_mm', hue='species')
<AxesSubplot:xlabel='flipper_length_mm', ylabel='bill_depth_mm'>
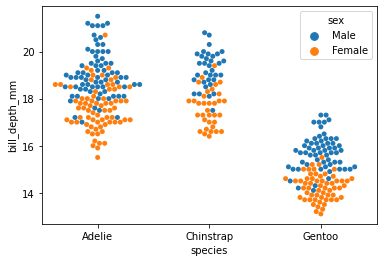
sns.swarmplot(data=dataset, x='species', y='bill_depth_mm', hue='sex')
<AxesSubplot:xlabel='species', ylabel='bill_depth_mm'>
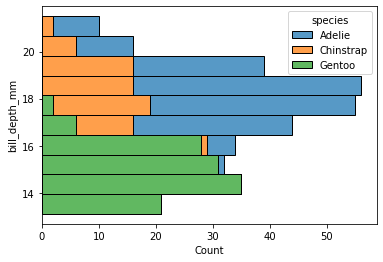
sns.histplot(data=dataset, y='bill_depth_mm', hue='species', multiple='stack')
<AxesSubplot:xlabel='Count', ylabel='bill_depth_mm'>
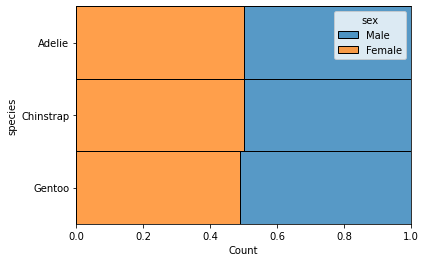
sns.histplot(data=dataset, y='species', hue='sex', discrete=True, multiple='fill')
<AxesSubplot:xlabel='Count', ylabel='species'>
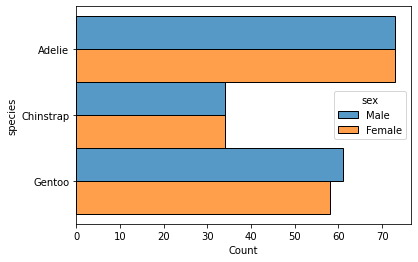
sns.histplot(data=dataset, y='species', hue='sex', discrete=True, multiple='dodge')
<AxesSubplot:xlabel='Count', ylabel='species'>
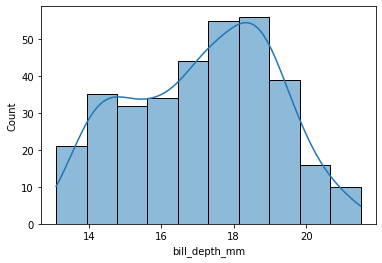
sns.histplot(data=dataset, x='bill_depth_mm', kde=True)
<AxesSubplot:xlabel='bill_depth_mm', ylabel='Count'>
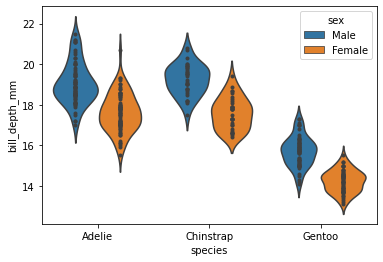
sns.violinplot(data=dataset, y='bill_depth_mm', x='species', inner='points', hue='sex')
<AxesSubplot:xlabel='species', ylabel='bill_depth_mm'>
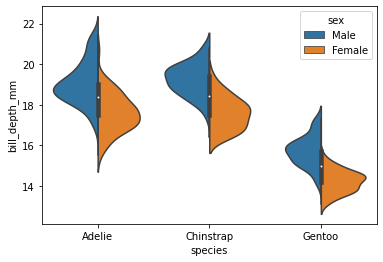
sns.violinplot(data=dataset, y='bill_depth_mm', x='species',
               hue='sex', split=True)
<AxesSubplot:xlabel='species', ylabel='bill_depth_mm'>
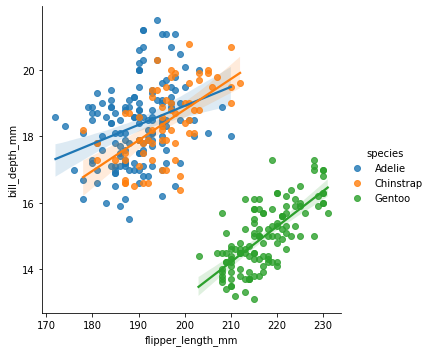
sns.lmplot(data=dataset, x='flipper_length_mm', y='bill_depth_mm', hue='species')
<seaborn.axisgrid.FacetGrid at 0x2bc059480>
← previous - home - next →