← previous - home - next →
Table of contents
- 1-2 Introduction and Line plots
- 3-4 Figures and Subplots
- 5-6 Styles and Aesthetics ← (Notebook)
- 7-8 Saving and Color maps
- 9 Histograms
- 10-11 Boxplots Violinplots and Scatter plots
- 12 Animations
- 13 On the usage of Seaborn
5. Plot styles
Different styles are available with matplotlib to customise your plots, you can list them with the command plt.style.available:
import numpy as np
import matplotlib as mpl
import matplotlib.pyplot as plt
import seaborn as sns
print(plt.style.available)
['Solarize_Light2', '_classic_test_patch', '_mpl-gallery', '_mpl-gallery-nogrid', 'bmh', 'classic', 'dark_background', 'fast', 'fivethirtyeight', 'ggplot', 'grayscale', 'seaborn', 'seaborn-bright', 'seaborn-colorblind', 'seaborn-dark', 'seaborn-dark-palette', 'seaborn-darkgrid', 'seaborn-deep', 'seaborn-muted', 'seaborn-notebook', 'seaborn-paper', 'seaborn-pastel', 'seaborn-poster', 'seaborn-talk', 'seaborn-ticks', 'seaborn-white', 'seaborn-whitegrid', 'tableau-colorblind10']
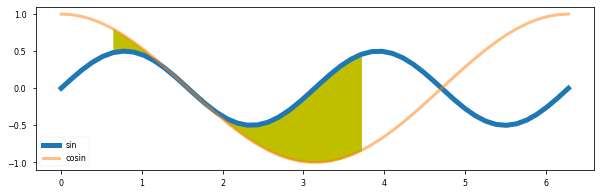
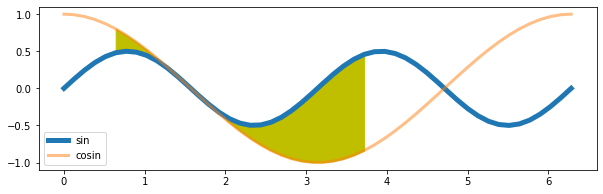
And you can use them with the command plt.style.context:
with plt.style.context('seaborn-paper'):
    X1 = np.linspace(0, 2*np.pi)
    X2 = np.linspace(0, 2*np.pi)
    Y1 = np.sin(X1*2)/2
    Y2 = np.cos(X2)

    fig, ax = plt.subplots(figsize=(10, 3))
    ax.plot(X1, Y1, '-', label='sin', lw=5)
    ax.plot(X2, Y2, '-', label='cosin', lw=3, alpha=.5)
    ax.fill_between(X1[5:30], Y1[5:30], Y2[5:30], color='y')
    ax.legend()
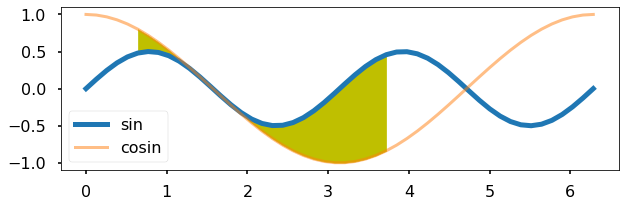
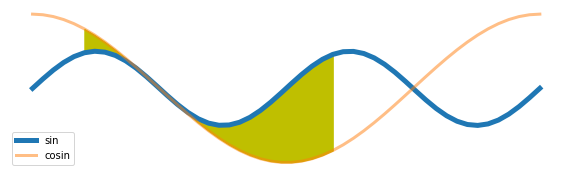
with plt.style.context('seaborn-poster'):
    X1 = np.linspace(0, 2*np.pi)
    X2 = np.linspace(0, 2*np.pi)
    Y1 = np.sin(X1*2)/2
    Y2 = np.cos(X2)

    fig, ax = plt.subplots(figsize=(10, 3), sharex=True, sharey=True)
    ax.plot(X1, Y1, '-', label='sin', lw=5)
    ax.plot(X2, Y2, '-', label='cosin', lw=3, alpha=.5)
    ax.fill_between(X1[5:30], Y1[5:30], Y2[5:30], color='y')
    ax.legend()
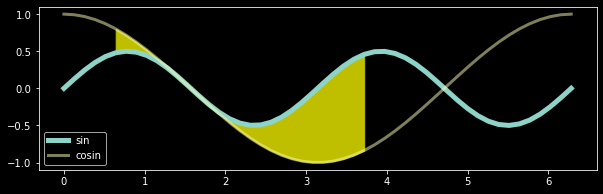
with plt.style.context('dark_background'):
    X1 = np.linspace(0, 2*np.pi)
    X2 = np.linspace(0, 2*np.pi)
    Y1 = np.sin(X1*2)/2
    Y2 = np.cos(X2)

    fig, ax = plt.subplots(figsize=(10, 3))
    ax.plot(X1, Y1, '-', label='sin', lw=5)
    ax.plot(X2, Y2, '-', label='cosin', lw=3, alpha=.5)
    ax.fill_between(X1[5:30], Y1[5:30], Y2[5:30], color='y')
    ax.legend()
Note the use of the with statement.
It is not necessary, but if you want to use a given style for only one figure, that is the easiest way to do so.
If you do not put the with statement, you will keep the style for the whole session.
All these styles are based on parameters that are stored in rcParams and can be seen from the dictionary plt.style.library
plt.style.library['dark_background']
RcParams({'axes.edgecolor': 'white',
          'axes.facecolor': 'black',
          'axes.labelcolor': 'white',
          'axes.prop_cycle': cycler('color', ['#8dd3c7', '#feffb3', '#bfbbd9', '#fa8174', '#81b1d2', '#fdb462', '#b3de69', '#bc82bd', '#ccebc4', '#ffed6f']),
          'boxplot.boxprops.color': 'white',
          'boxplot.capprops.color': 'white',
          'boxplot.flierprops.color': 'white',
          'boxplot.flierprops.markeredgecolor': 'white',
          'boxplot.whiskerprops.color': 'white',
          'figure.edgecolor': 'black',
          'figure.facecolor': 'black',
          'grid.color': 'white',
          'lines.color': 'white',
          'patch.edgecolor': 'white',
          'savefig.edgecolor': 'black',
          'savefig.facecolor': 'black',
          'text.color': 'white',
          'xtick.color': 'white',
          'ytick.color': 'white'})
plt.style.library['seaborn-poster']
RcParams({'axes.labelsize': 17.6,
          'axes.titlesize': 19.2,
          'figure.figsize': [12.8, 8.8],
          'grid.linewidth': 1.6,
          'legend.fontsize': 16.0,
          'lines.linewidth': 2.8,
          'lines.markeredgewidth': 0.0,
          'lines.markersize': 11.2,
          'patch.linewidth': 0.48,
          'xtick.labelsize': 16.0,
          'xtick.major.pad': 11.2,
          'xtick.major.width': 1.6,
          'xtick.minor.width': 0.8,
          'ytick.labelsize': 16.0,
          'ytick.major.pad': 11.2,
          'ytick.major.width': 1.6,
          'ytick.minor.width': 0.8})
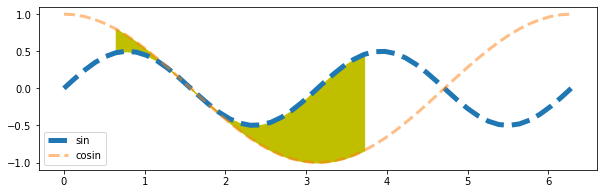
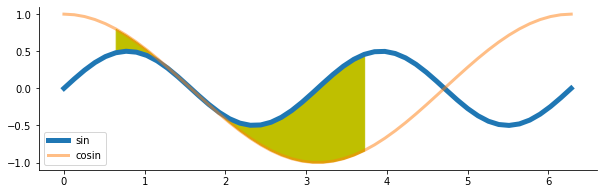
Each of these parameters can be checked and changed via mpl.rcParams:
mpl.rcParams['lines.linestyle'] = '--'
X1 = np.linspace(0, 2*np.pi)
X2 = np.linspace(0, 2*np.pi)
Y1 = np.sin(X1*2)/2
Y2 = np.cos(X2)

fig, ax = plt.subplots(figsize=(10, 3))
ax.plot(X1, Y1, label='sin', lw=5)
ax.plot(X2, Y2, label='cosin', lw=3, alpha=.5)
ax.fill_between(X1[5:30], Y1[5:30], Y2[5:30], color='y')
ax.legend();
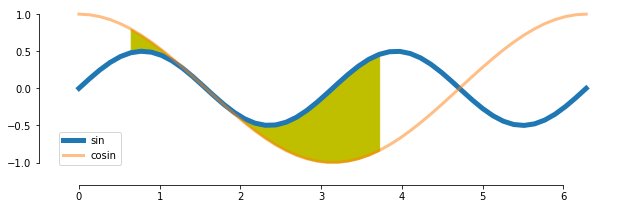
If you made too many changes and you do not remember what were the original settings you can call the function mpl.rcdefaults():
# mpl.rcdefaults()
mpl.rcParams['lines.linestyle'] = '-'
X1 = np.linspace(0, 2*np.pi)
X2 = np.linspace(0, 2*np.pi)
Y1 = np.sin(X1*2)/2
Y2 = np.cos(X2)

fig, ax = plt.subplots(figsize=(10, 3))
ax.plot(X1, Y1, '-', label='sin', lw=5)
ax.plot(X2, Y2, '-', label='cosin', lw=3, alpha=.5)
ax.fill_between(X1[5:30], Y1[5:30], Y2[5:30], color='y')
ax.legend();
6. Changing the aesthetics of the figure
On top of the previous styles and parameters you can further customise your plots, for example you can remove the frame:
X1 = np.linspace(0, 2*np.pi)
X2 = np.linspace(0, 2*np.pi)
Y1 = np.sin(X1*2)/2
Y2 = np.cos(X2)

fig, ax = plt.subplots(figsize=(10, 3))
ax.plot(X1, Y1, '-', label='sin', lw=5)
ax.plot(X2, Y2, '-', label='cosin', lw=3, alpha=.5)
ax.fill_between(X1[5:30], Y1[5:30], Y2[5:30], color='y')
# Here is the line to remove the frame:
ax.set_frame_on(False)
# And the lines to remove the ticks in the x and y axes
ax.set_xticks([])
ax.set_yticks([])
ax.legend();
Or just the right and top part of the frame:
X1 = np.linspace(0, 2*np.pi)
X2 = np.linspace(0, 2*np.pi)
Y1 = np.sin(X1*2)/2
Y2 = np.cos(X2)

fig, ax = plt.subplots(figsize=(10, 3))
ax.plot(X1, Y1, '-', label='sin', lw=5)
ax.plot(X2, Y2, '-', label='cosin', lw=3, alpha=.5)
ax.fill_between(X1[5:30], Y1[5:30], Y2[5:30], color='y')
ax.spines['right'].set_visible(False)
ax.spines['top'].set_visible(False)
ax.legend();
Offsetting the axes:
X1 = np.linspace(0, 2*np.pi)
X2 = np.linspace(0, 2*np.pi)
Y1 = np.sin(X1*2)/2
Y2 = np.cos(X2)

fig, ax = plt.subplots(figsize=(10, 3))
ax.plot(X1, Y1, '-', label='sin', lw=5)
ax.plot(X2, Y2, '-', label='cosin', lw=3, alpha=.5)
ax.fill_between(X1[5:30], Y1[5:30], Y2[5:30], color='y')
ax.spines['right'].set_visible(False)
ax.spines['top'].set_visible(False)
# Here is the offset
ax.spines['bottom'].set_position(('outward', 15))
ax.spines['left'].set_position(('outward', 15))
ax.legend();

Even triming the axes (slightly more complicated):
X1 = np.linspace(0, 2*np.pi)
X2 = np.linspace(0, 2*np.pi)
Y1 = np.sin(X1*2)/2
Y2 = np.cos(X2)

fig, ax = plt.subplots(figsize=(10, 3))
ax.plot(X1, Y1, '-', label='sin', lw=5)
ax.plot(X2, Y2, '-', label='cosin', lw=3, alpha=.5)
ax.fill_between(X1[5:30], Y1[5:30], Y2[5:30], color='y')
ax.spines['right'].set_visible(False)
ax.spines['top'].set_visible(False)
ax.spines['bottom'].set_position(('outward', 15))
ax.spines['left'].set_position(('outward', 15))

# getting the x ticks
xticks = np.asarray(ax.get_xticks())
# getting the first and last ticks to know where to trim
firsttick = xticks[min(ax.get_xlim()) <= xticks][0]
lasttick = xticks[xticks <= max(ax.get_xlim())][-1]
# setting the bounds of the x axis
ax.spines['bottom'].set_bounds(firsttick, lasttick)
# cleaning the ticks (sometimes they are unshown ticks)
xticks = xticks[(firsttick <= xticks) & (xticks <= lasttick)]
ax.set_xticks(xticks)

# same for y axis
yticks = np.asarray(ax.get_yticks())
firsttick = yticks[min(ax.get_ylim()) <= yticks][0]
lasttick = yticks[yticks <= max(ax.get_ylim())][-1]
ax.spines['left'].set_bounds(firsttick, lasttick)
yticks = yticks[(firsttick <= yticks) & (yticks <= lasttick)]
ax.set_yticks(yticks)

ax.legend();
There is another way to do that using seaborn, but we will explore that later if we have time:
X1 = np.linspace(0, 2*np.pi)
X2 = np.linspace(0, 2*np.pi)
Y1 = np.sin(X1*2)/2
Y2 = np.cos(X2)

fig, ax = plt.subplots(figsize=(10, 3))
ax.plot(X1, Y1, '-', label='sin', lw=5)
ax.plot(X2, Y2, '-', label='cosin', lw=3, alpha=.5)
ax.fill_between(X1[5:30], Y1[5:30], Y2[5:30], color='y')
sns.despine(trim=True, offset=15, ax=ax)
ax.legend();

← previous - home - next →