Distance Calculation
For comparisons across embryos the User Interface remains as close as possible to Distance Calculation. However some changes have been made to accommodate the needs of such an analysis. It is the Cross Distance Calculation entry of the Cross Lineagetree comparison widget, and uses the datasets of the Manager.
Configuration
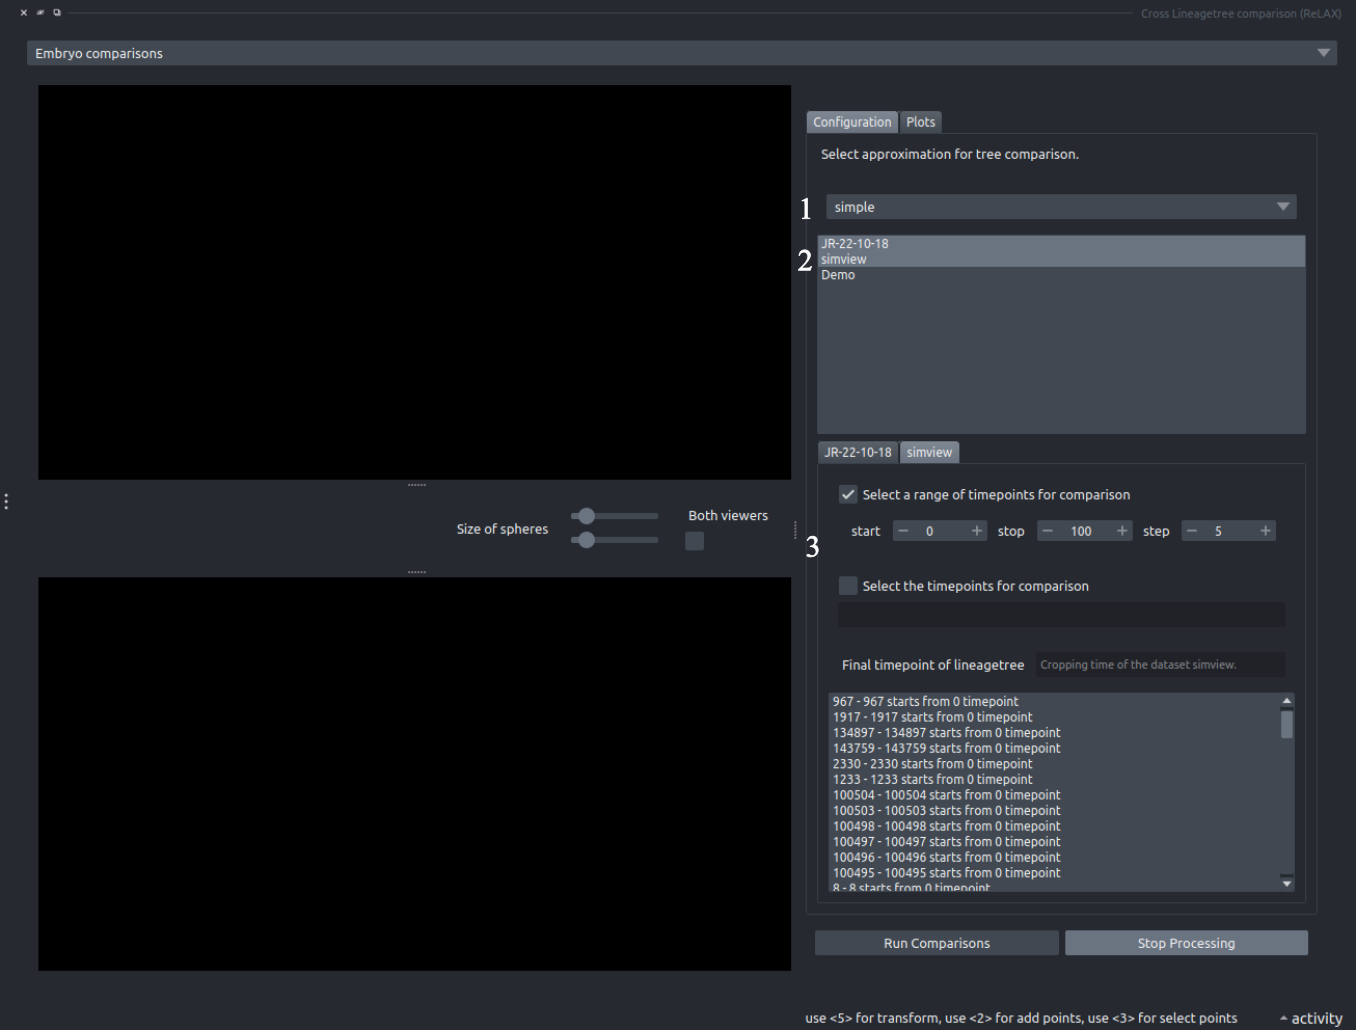
- Tree approximation selection: Similar to Distance Calculation. With
downsampled, the downsampling rate is expressed on a common time scale, and its tooltip shows the real rate used for each dataset, so any differences in time resolution are handled automatically by the manager. - Dataset Selection: The user may select as many datasets from the manager as they want. Each selected dataset is added as a tab on 3.
- Configuring the roots: This component is identical to Distance Calculation. An Important thing is that the user has to decide the levels of comparison and the crop times independently, so these comparisons need some prior rough analysis using the populations of cells of an embryo.
Press Run Comparisons to start. If a dataset name is long (more than 6 characters), ReLAX warns that the clustermap labels may misbehave and asks whether to continue; to use shorter names, rename the layers before creating the manager.
Plots
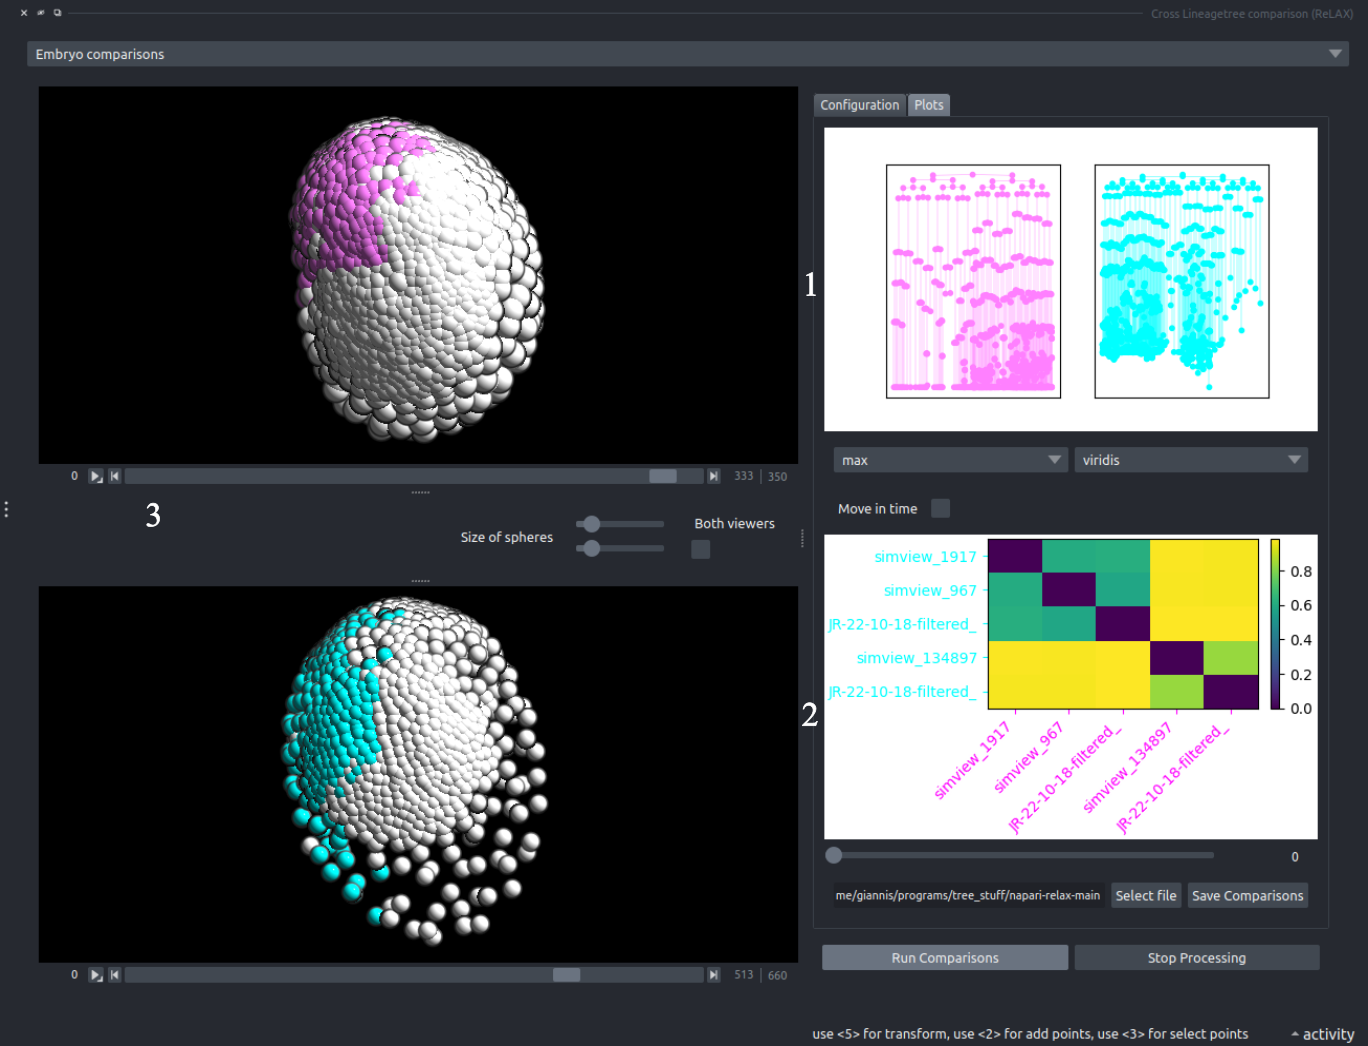
- Tree graphs: The lineages that are currently being compared.
- The clustermap: The clustermap that contains all the roots that are being compared, with the same normalization, colormap, Move in time, hover and save options as in Distance Calculation. Each label starts with the name of its dataset.
- The 2 dataset viewers: These viewers work independently of each other so the user may inspect different timepoints and different angles in each dataset. The Size of spheres sliders change the point size in each viewer, or in both when Both viewers is ticked. In this specific image the El lineage of 2 Parhyale hawaiensis embryos is being compared.
Go to Starting page
Go to Tutorials